Matlab给系统自动生成的窗体Figure1改名称
的有关信息介绍如下:
MATLAB是美国MathWorks公司出品的商业数学软件,用于算法开发、数据可视化、数据分析以及数值计算的高级技术计算语言和交互式环境,主要包括MATLAB和Simulink两大部分。
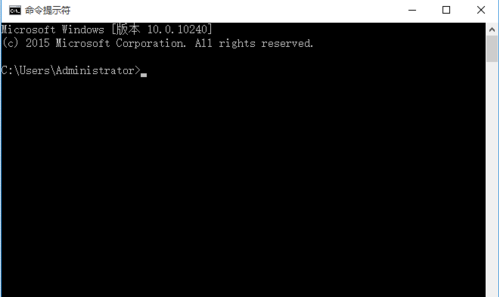
当我们调用plot()函数时MATLAB会自动生成一个命名为Figure1的窗体,我们想修改它的名字。如下图
在命令行中输入如下代码
figure('NumberTitle', 'off', 'Name', '晓博基于BP神经网络的xor测试程序');
运行代码,结果如下图
对于窗体中的坐标线和说明文字显示我们加入如下代码
hold on %刷新窗口
plot(a(:,1),a(:,2),'r--');%绘图函数
title('四组数据仿真的预测输出分部');
xlabel('仿真次序'); %x轴
ylabel('仿真的预测输出');%y轴
对于窗体中加入自已定位的文字的方法进行介绍,效果如下图
a=get(gca);
x=a.XLim;%获取横坐标上下限
y=a.YLim;%获取纵坐标上下限
k=[0.8 0.9];%给定text相对位置
x0=x(1)+k(1)*(x(2)-x(1));%获取text横坐标
y0=y(1)+k(2)*(y(2)-y(1));%获取text纵坐标
t=sprintf('仿真修正:+ \n期望:O');
text(x0,y0,t,'fontsize',8);
其中各属性的设置如下
画等值线
[cc hh]=contour(peaks(30),'LINESPEC','b-')
clabel(cc,hh,'manual')
%写文本
text(5,10,'\bf math \sl math \it math \rm math \alpha','color',[0.1 0.1 0.9],'fontsize',24)
%设置线宽
set(gca,'linewidth',2)
%写标题并设置字体的大小
ti=title('Title of My Figure','color','blue')
set(ti,'fontsize',24)
drawnow
%输出文件
print -dpsc plotE.ps
print -append -dpsc plotE.ps
print -djpeg100 plotE.jpg
%给定图窗口标题
figure('Name','My Figure1')
%设置使用调色板
map=hsv(32);
colormap(map)
%设定等值线的范围
caxis([-6 6])
%设定colorbar的方向和位置
hc=colorbar('hori');
po=get(hc,'position');
%set(hc,'position',[po(1) po(2)+0.14 po(3) po(4)-0.01]);
%set(hc,'XLim',[0 300]);
%设置绘图的缺省值
set(0,'DefaultLineLineWidth',2)
set(0,'DefaultAxesFontSize',18)
set(0,'DefaultAxesLineWidth',2)
set(0,'DefaultAxesTickLength',[0.01 0.025])
set(0,'DefaultPatchLineWidth',2)
set(0,'DefaultSurfaceLineWidth',2)
set(0,'DefaultRectangleLineWidth',2)
set(0,'DefaultLineLineWidth','remove')
set(0,'DefaultAxesFontSize','remove')
set(0,'DefaultAxesLineWidth','remove')
set(0,'DefaultAxesTickLength','remove')
set(0,'DefaultPatchLineWidth','remove')
set(0,'DefaultSurfaceLineWidth','remove')
set(0,'DefaultRectangleLineWidth','remove')
%%set(0,'DefaultLineLineWidth','factory')
%%get(0,'factory')
%设置坐标轴的间隔和显示
set(gca,'XTick',[0:1:25],'YTick',[0:300:6000])
set(gca,'XTickLabelMode','manual')
set(gca,'XTickLabel','0|||||5|||||10|||||15|||||20|||||25|')
%分别设置等值线和等值线标注的间隔
[cc hh]=contour(peaks(30),[-6:2:8])
c(cc,hh,[-6:4:8],'fontsize',15,'color','r','rotation',0,'labelspacing',200)
%%%%%%%%%%%%%%%%%%%%%%%%%%%%%%%%%%%%%
%%%%%%几个实例%%%%%
%给定月份名字
name='JanFebMarAprMayJunJulAugSepOctNovDec'
%给定每层深度
depth=[5 15 25 35 45 55 65 75 85 95 110 130 155 185 220 260 305 365 450 575 755 1115 1735 2615 3645 4830]
%给定经纬度
x=31:1:288;
y=-61:1:61;
[lo la]=meshgrid(x,y);
%等值线间距
vt=2:2:30;
vs=30:0.5:36;
vc=10:5:200;
%打开文件读取数据
h1=fopen(['plotE' '.dat']);
u=fscanf(h1,'%f',[258 123]);
v=fscanf(h1,'%f',[258 123]);
t=fscanf(h1,'%f',[258 123]);
s=fscanf(h1,'%f',[258 123]);
ccc=fscanf(h1,'%f',[258 123]);
%设置流速标尺
u(20,220)=0.5;
%%%%%%%%figure1%%%%%%%%等值线
figure;
m_proj('Lambert','lon',[31 288],'lat',[-61 61]);
hold on;
[cc hh]=m_contour(lo,la,ccc);
c(cc,hh,'fontsize',6);
title('carbon concentration');
m_coast('patch',[0.1 0.1 0.8])
m_grid('linestyle','none','box','fancy','linewidth',2,'XaxisLocation','bottom')
print -dpsc mmap.ps
%%%%%%%%figure2%%%%%%%%矢量图
figure;
m_proj('Equidistant','lon',[31 288],'lat',[-61 61]);
hold on;
m_coast('patch',[0.3 0.5 0.3]);
m_grid('linestyle','none','tickdir','out','linewidth',2,'XaxisLocation','top')
hq=m_quiver(lo,la,u',v',2)
set(hq,'color','b')
m_text(240,54,'0.5 cm s^{-1}','color','r','fontsize',10)
print -dpsc -append mmap.ps
%%%%%%%%figure3%%%%%%%%使用高分辨率岸线
figure;
m_proj('Equidistant','lon',[31 288],'lat',[-61 61]);
hold on;
m_contour(lo,la,t)
hq=m_quiver(lo,la,u,v,2)
set(hq,'color','b')
m_text(240,54,'50 cm s^{-1}','color','r','fontsize',10)
m_coast('patch',[0.1 0.1 0.8]);
m_grid('linestyle','none','tickdir','out','linewidth',2,'XaxisLocation','top')
%m_gshhs_i('patch',[0.1 0.1 0.8]);
%m_gshhs_h('patch',[0.1 0.1 0.6]);
%m_gshhs_h('save','gumby');
%m_usercoast('gumby','patch',[0.1 0.1 0.6]);
print -dpsc -append mmap.ps
%%%%%%%%figure4%%%%%%%%直线图
figure;
m_proj('Equidistant','lon',[31 288],'lat',[-61 61]);
hold on;m_coast('patch',[0.1 0.1 0.8]);
lo1=[180:5:270]
la1=[-30:5:60]
m_line(lo1,la1,'marker','.','markersize',20,'linestyle','none')
m_grid('linestyle','none','tickdir','out','linewidth',2,'XaxisLocation','top','xtick',12)
print -dpsc -append mmap.ps